Software
Intel Inspector
Intel Inspector is available to all users of HPC2N.
Intel Inspector XE is an easy to use memory error checker and thread checker for serial and parallel applications.
Intel Inspector is a memory and thread checking and debugging tool to increase the reliability, security, and accuracy of C/C++ and Fortran applications.
- Reliability: Find deadlocks and memory errors that cause lockups & crashes
- Security: Find memory and threading vulnerabilities used by hackers
- Accuracy: Identify memory corruption and race conditions to eliminate erroneous results
Memory checking includes memory leaks, dangling pointers, uninitialized variables, use of invalid memory references, mismatched memory, allocation and deallocation, stack memory checks, and stack trace with controllable stack trace depth
Thread checking includes race conditions, deadlocks, depth configurable call stack analysis, diagnostic guidance, built-in knowledge of Threading Building Blocks (TBB), OpenMP, and POSIX or Win32 threads.
On HPC2N we have Intel Inspector available as a module on Kebnekaise.
Since Intel Inspector has a GUI, you will want to login with X11 forwarding turned on and with
ssh -Y username@host
if you want to use it that way.
To use the Intel Inspector module, first add it to your environment. Use:
module spider inspector
to see which versions are available and how to load the module and the needed prerequisites.
Example, loading Intel Inspector 2017
ml Inspector/2017_update1
You can read more about loading modules on our Accessing software with Lmod page and our Using modules (Lmod) page.
Usage
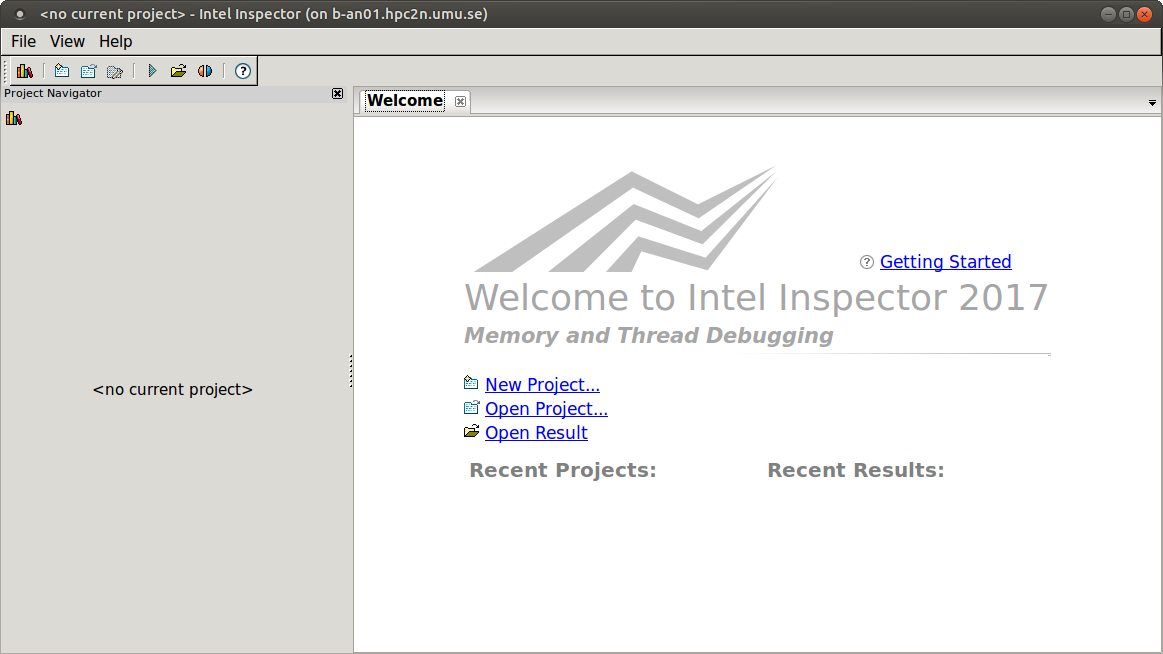
Intel Inspector is started with the command
inspxe-gui
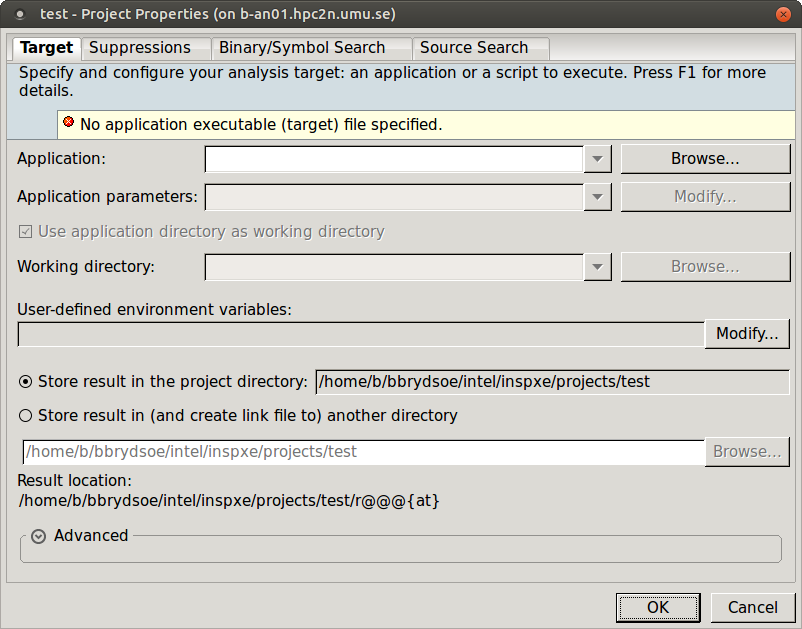
Create a new project - browse to a suitable directory and give it a name, then click "OK". You will the get this
Browse to the location of your executable (preferrably compiled with debugging information) and open it.
More information about using Intel Inspector


